Laughing Kookaburra
Dacelo novaeguineae
ABR description
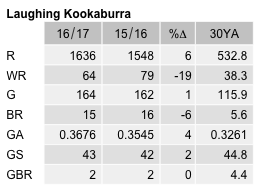
The following is extracted from the Annual Bird Report for the twelve months to June 2017.
Common, breeding resident
This species is showing a slow, slight but steady decline in the region over the last 18 years.
General: Reporting rate 11.8% is down 11% on last year, 20% on the 10 YA and 40% on the 30YA. In 1999, the reporting rate was 20% and since then there has been a slow and steady decline to the current value. Seasonal records: spring 24% summer 30% autumn 28% and winter 19%. Max 12/11 Nov Tallaganda SF GrV19 (LaK1), average 1.8 and median 1. Earliest breeding was br/22 Oct Red Hill (CnM1) and latest dy/15 Feb Ginninderra Ck Latham Gr L12 (KiB1).
GBS: Recorded all seasons with summer max 27%. The A value has varied from approx. A=0.6 at the beginning of the survey, down to A=0.2 in the mid-nineties, back up to about A=0.4 now. Average 1.8, median 2 with max 12/2wk Dec Ainslie (HaS3). 2 breeding records of the same event: on/4wk Nov and on/1wk Dec Watson (WaK1).
Abundance
Abundance is the average number of birds of that species per survey. Where the species was observed (presence recorded) but the number of birds seen was not recorded, this is treated as a count of zero.
Abundance by year
This chart shows the abundance of Laughing Kookaburra between 1982 and 2017. 
Abundance by month
This chart shows the monthly abundance of Laughing Kookaburra. The blue lines show the abundance for the twelve months to June 2017 and the bars show the average abundance for the period 1982 to 2017. 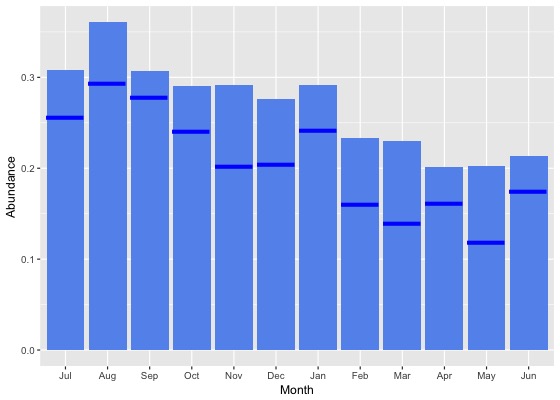
Abundance by season
This chart shows the seasonal abundance of Laughing Kookaburra. The blue lines show the seasonal abundance for the twelve months to June 2017 and the bars show the average seasonal abundance for the period 1982 to 2017. 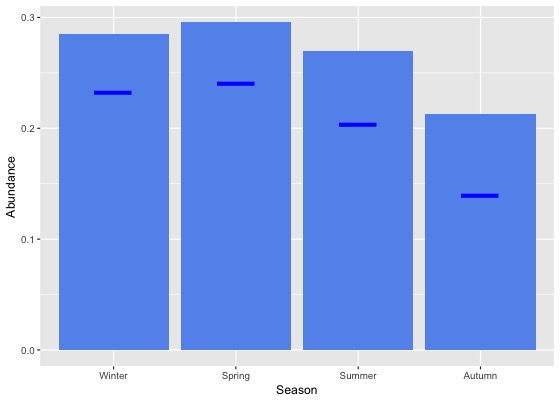
Abundance data
| Month | Season | ||||||||||||||||||
|---|---|---|---|---|---|---|---|---|---|---|---|---|---|---|---|---|---|---|---|
| Period | Jul | Aug | Sep | Oct | Nov | Dec | Jan | Feb | Mar | Apr | May | Jun | Winter | Spring | Summer | Autumn | All | ||
| All years | |||||||||||||||||||
| All | 0.3 | 0.4 | 0.3 | 0.3 | 0.3 | 0.3 | 0.3 | 0.2 | 0.2 | 0.2 | 0.2 | 0.2 | 0.3 | 0.3 | 0.3 | 0.2 | 0.3 | ||
| Previous years | |||||||||||||||||||
| All previous years | 0.3 | 0.4 | 0.3 | 0.3 | 0.3 | 0.3 | 0.3 | 0.2 | 0.2 | 0.2 | 0.2 | 0.2 | 0.3 | 0.3 | 0.3 | 0.2 | 0.3 | ||
| Previous 30 years | 0.3 | 0.4 | 0.3 | 0.3 | 0.3 | 0.3 | 0.3 | 0.2 | 0.2 | 0.2 | 0.2 | 0.2 | 0.3 | 0.3 | 0.3 | 0.2 | 0.3 | ||
| Previous 20 years | 0.3 | 0.4 | 0.3 | 0.3 | 0.3 | 0.3 | 0.3 | 0.2 | 0.2 | 0.2 | 0.2 | 0.2 | 0.3 | 0.3 | 0.2 | 0.2 | 0.2 | ||
| 10 year groups | |||||||||||||||||||
| [2007,2017) | 0.3 | 0.4 | 0.3 | 0.3 | 0.2 | 0.2 | 0.2 | 0.2 | 0.2 | 0.2 | 0.2 | 0.2 | 0.3 | 0.3 | 0.2 | 0.2 | 0.2 | ||
| [1997,2007) | 0.3 | 0.3 | 0.3 | 0.3 | 0.3 | 0.3 | 0.3 | 0.3 | 0.2 | 0.2 | 0.2 | 0.2 | 0.3 | 0.3 | 0.3 | 0.2 | 0.3 | ||
| [1987,1997) | 0.5 | 0.5 | 0.5 | 0.4 | 0.5 | 0.5 | 0.5 | 0.4 | 0.5 | 0.4 | 0.4 | 0.3 | 0.4 | 0.5 | 0.5 | 0.4 | 0.4 | ||
| 5 year groups | |||||||||||||||||||
| [2012,2017) | 0.3 | 0.4 | 0.3 | 0.3 | 0.2 | 0.2 | 0.2 | 0.2 | 0.2 | 0.2 | 0.2 | 0.2 | 0.3 | 0.3 | 0.2 | 0.2 | 0.2 | ||
| [2007,2012) | 0.2 | 0.3 | 0.3 | 0.3 | 0.3 | 0.3 | 0.3 | 0.2 | 0.2 | 0.1 | 0.2 | 0.2 | 0.2 | 0.3 | 0.3 | 0.2 | 0.2 | ||
| [2002,2007) | 0.2 | 0.3 | 0.3 | 0.3 | 0.3 | 0.3 | 0.2 | 0.2 | 0.2 | 0.2 | 0.2 | 0.2 | 0.2 | 0.3 | 0.3 | 0.2 | 0.2 | ||
| [1997,2002) | 0.3 | 0.3 | 0.3 | 0.3 | 0.3 | 0.3 | 0.4 | 0.3 | 0.2 | 0.2 | 0.2 | 0.2 | 0.3 | 0.3 | 0.3 | 0.2 | 0.3 | ||
| [1992,1997) | 0.4 | 0.4 | 0.4 | 0.4 | 0.4 | 0.4 | 0.5 | 0.3 | 0.4 | 0.2 | 0.3 | 0.2 | 0.3 | 0.4 | 0.4 | 0.3 | 0.3 | ||
| [1987,1992) | 0.5 | 0.5 | 0.5 | 0.5 | 0.5 | 0.5 | 0.5 | 0.4 | 0.5 | 0.5 | 0.4 | 0.4 | 0.5 | 0.5 | 0.5 | 0.5 | 0.5 | ||
| Year | |||||||||||||||||||
| 2017 | 0.3 | 0.3 | 0.3 | 0.2 | 0.2 | 0.2 | 0.2 | 0.2 | 0.1 | 0.2 | 0.1 | 0.2 | 0.2 | 0.2 | 0.2 | 0.1 | 0.2 | ||
| 2016 | 0.4 | 0.4 | 0.3 | 0.3 | 0.2 | 0.2 | 0.2 | 0.2 | 0.2 | 0.2 | 0.2 | 0.2 | 0.3 | 0.3 | 0.2 | 0.2 | 0.2 | ||
| 2015 | 0.2 | 0.5 | 0.3 | 0.3 | 0.3 | 0.3 | 0.3 | 0.2 | 0.2 | 0.2 | 0.2 | 0.2 | 0.3 | 0.3 | 0.3 | 0.2 | 0.3 | ||
| 2014 | 0.3 | 0.2 | 0.2 | 0.3 | 0.2 | 0.2 | 0.3 | 0.3 | 0.2 | 0.2 | 0.2 | 0.3 | 0.3 | 0.3 | 0.3 | 0.2 | 0.2 | ||
| 2013 | 0.2 | 0.3 | 0.2 | 0.3 | 0.3 | 0.2 | 0.2 | 0.2 | 0.1 | 0.1 | 0.1 | 0.1 | 0.2 | 0.3 | 0.2 | 0.1 | 0.2 | ||
| 2012 | 0.3 | 0.3 | 0.2 | 0.2 | 0.2 | 0.2 | 0.2 | 0.2 | 0.3 | 0.2 | 0.2 | 0.2 | 0.3 | 0.2 | 0.2 | 0.3 | 0.2 | ||
| 2011 | 0.3 | 0.4 | 0.3 | 0.3 | 0.3 | 0.2 | 0.2 | 0.2 | 0.2 | 0.1 | 0.1 | 0.2 | 0.3 | 0.3 | 0.2 | 0.1 | 0.2 | ||
| 2010 | 0.3 | 0.3 | 0.3 | 0.3 | 0.3 | 0.3 | 0.2 | 0.2 | 0.1 | 0.1 | 0.2 | 0.1 | 0.2 | 0.3 | 0.3 | 0.1 | 0.2 | ||
| 2009 | 0.2 | 0.2 | 0.3 | 0.3 | 0.2 | 0.2 | 0.4 | 0.2 | 0.2 | 0.1 | 0.2 | 0.2 | 0.2 | 0.3 | 0.3 | 0.2 | 0.2 | ||
| 2008 | 0.3 | 0.4 | 0.4 | 0.3 | 0.3 | 0.3 | 0.4 | 0.3 | 0.3 | 0.2 | 0.4 | 0.2 | 0.3 | 0.3 | 0.3 | 0.2 | 0.3 | ||
| 2007 | 0.1 | 0.3 | 0.1 | 0.3 | 0.4 | 0.3 | 0.3 | 0.3 | 0.2 | 0.1 | 0.2 | 0.2 | 0.2 | 0.2 | 0.3 | 0.2 | 0.2 | ||
| 2006 | 0.3 | 0.4 | 0.2 | 0.4 | 0.3 | 0.3 | 0.2 | 0.3 | 0.3 | 0.2 | 0.3 | 0.3 | 0.3 | 0.3 | 0.3 | 0.3 | 0.3 | ||
| 2005 | 0.2 | 0.3 | 0.2 | 0.2 | 0.3 | 0.4 | 0.3 | 0.4 | 0.2 | 0.1 | 0.2 | 0.2 | 0.2 | 0.2 | 0.4 | 0.2 | 0.2 | ||
| 2004 | 0.2 | 0.4 | 0.3 | 0.2 | 0.4 | 0.3 | 0.3 | 0.3 | 0.2 | 0.2 | 0.2 | 0.1 | 0.2 | 0.3 | 0.3 | 0.2 | 0.2 | ||
| 2003 | 0.3 | 0.4 | 0.3 | 0.2 | 0.4 | 0.3 | 0.2 | 0.1 | 0.2 | 0.2 | 0.1 | 0.1 | 0.3 | 0.3 | 0.2 | 0.2 | 0.2 | ||
| 2002 | 0.3 | 0.3 | 0.3 | 0.2 | 0.2 | 0.2 | 0.2 | 0.2 | 0.2 | 0.1 | 0.2 | 0.2 | 0.2 | 0.2 | 0.2 | 0.2 | 0.2 | ||
| 2001 | 0.4 | 0.3 | 0.3 | 0.3 | 0.3 | 0.4 | 0.3 | 0.3 | 0.2 | 0.2 | 0.2 | 0.3 | 0.3 | 0.3 | 0.4 | 0.2 | 0.3 | ||
| 2000 | 0.3 | 0.3 | 0.4 | 0.3 | 0.3 | 0.3 | 0.4 | 0.3 | 0.3 | 0.2 | 0.2 | 0.2 | 0.3 | 0.3 | 0.3 | 0.3 | 0.3 | ||
| 1999 | 0.3 | 0.5 | 0.2 | 0.3 | 0.4 | 0.4 | 0.4 | 0.3 | 0.2 | 0.2 | 0.2 | 0.1 | 0.2 | 0.3 | 0.4 | 0.2 | 0.3 | ||
| 1998 | 0.0 | 0.4 | 0.3 | 0.2 | 0.2 | 0.2 | 0.4 | 0.2 | 0.0 | 0.1 | 0.1 | 0.1 | 0.2 | 0.3 | 0.3 | 0.0 | 0.2 | ||
| 1997 | 0.3 | 0.3 | 0.1 | 0.2 | 0.1 | 0.1 | 0.4 | 0.1 | 0.2 | 0.2 | 0.1 | 0.0 | 0.2 | 0.2 | 0.2 | 0.2 | 0.2 | ||
| 1996 | 0.1 | 0.3 | 0.4 | 0.2 | 0.2 | 0.3 | 0.6 | 0.2 | 0.2 | 0.2 | 0.3 | 0.4 | 0.3 | 0.3 | 0.4 | 0.2 | 0.3 | ||
| 1995 | 0.4 | 0.2 | 0.1 | 0.2 | 0.2 | 0.2 | 0.3 | 0.2 | 0.1 | 0.2 | 0.2 | 0.1 | 0.2 | 0.2 | 0.3 | 0.2 | 0.2 | ||
| 1994 | 0.4 | 0.7 | 0.5 | 0.5 | 0.4 | 0.4 | 0.6 | 0.3 | 0.4 | 0.1 | 0.2 | 0.2 | 0.4 | 0.4 | 0.5 | 0.2 | 0.4 | ||
| 1993 | 0.4 | 0.6 | 0.7 | 0.6 | 0.7 | 0.7 | 0.7 | 0.3 | 0.9 | 0.3 | 0.3 | 0.2 | 0.4 | 0.6 | 0.6 | 0.5 | 0.5 | ||
| 1992 | 0.5 | 0.1 | 0.6 | 0.6 | 0.6 | 0.4 | 0.2 | 0.5 | 0.5 | 0.6 | 0.4 | 0.1 | 0.3 | 0.6 | 0.4 | 0.5 | 0.4 | ||
| 1991 | 0.3 | 0.4 | 0.5 | 0.4 | 0.8 | 0.4 | 0.4 | 0.4 | 0.5 | 0.7 | 0.3 | 0.5 | 0.4 | 0.6 | 0.4 | 0.5 | 0.5 | ||
| 1990 | 0.5 | 0.5 | 0.3 | 0.2 | 0.3 | 0.4 | 0.5 | 0.4 | 0.5 | 0.4 | 0.4 | 0.3 | 0.5 | 0.3 | 0.4 | 0.4 | 0.4 | ||
| 1989 | 0.6 | 0.5 | 0.6 | 0.6 | 0.5 | 0.6 | 0.6 | 0.4 | 0.5 | 0.4 | 0.5 | 0.4 | 0.5 | 0.6 | 0.5 | 0.5 | 0.5 | ||
| 1988 | 0.5 | 0.5 | 0.6 | 0.5 | 0.5 | 0.6 | 0.5 | 0.5 | 0.5 | 0.5 | 0.4 | 0.5 | 0.5 | 0.6 | 0.5 | 0.5 | 0.5 | ||
| 1987 | 0.5 | 0.3 | 0.5 | 0.4 | 0.5 | 0.5 | 0.5 | 0.4 | 0.5 | 0.4 | 0.4 | 0.3 | 0.3 | 0.5 | 0.5 | 0.4 | 0.4 | ||
| 1986 | 0.2 | 0.4 | 0.4 | 0.2 | 0.4 | 0.1 | 0.3 | 0.4 | 0.4 | 0.4 | 0.3 | 0.2 | 0.3 | 0.3 | 0.3 | 0.4 | 0.3 | ||
| 1985 | 0.3 | 0.1 | 0.1 | 0.1 | 0.1 | 0.1 | 0.2 | 0.3 | 0.5 | 0.5 | 0.3 | 0.4 | 0.3 | 0.1 | 0.2 | 0.5 | 0.2 | ||
| 1984 | 0.0 | 0.0 | 0.0 | 0.0 | 0.0 | 0.0 | 0.5 | 0.1 | 0.0 | 0.1 | 0.2 | 0.1 | 0.1 | 0.0 | 0.2 | 0.1 | 0.1 | ||
| 1983 | 0.0 | 0.0 | 0.0 | 0.0 | 0.1 | 0.1 | 0.0 | 0.0 | 0.0 | - | 0.0 | 0.0 | 0.0 | 0.0 | 0.0 | 0.0 | 0.0 | ||
| 1982 | - | 0.0 | - | 0.0 | 0.0 | 0.0 | - | 0.0 | - | 0.0 | - | 0.0 | 0.0 | 0.0 | 0.0 | 0.0 | 0.0 | ||
Reporting rates
Reporting rate is the proportion of all surveys in which the species was present.
Reporting rate by year
This chart shows the reporting rate of Laughing Kookaburra each year between 1982 and 2017. 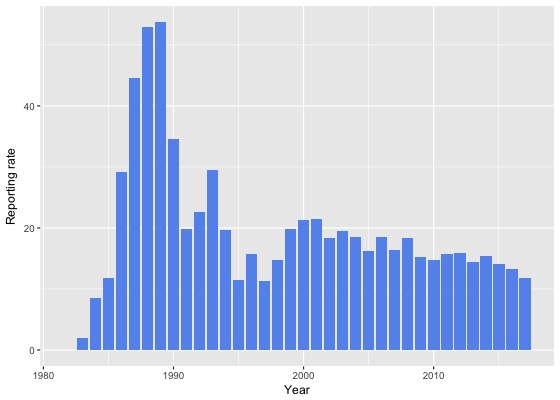
Reporting rate by month
This chart shows the reporting rate by month of Laughing Kookaburra. The blue lines show the reporting rate for the twelve months to June 2017 and the bars show the average reporting rate for the period 1982 to 2017. 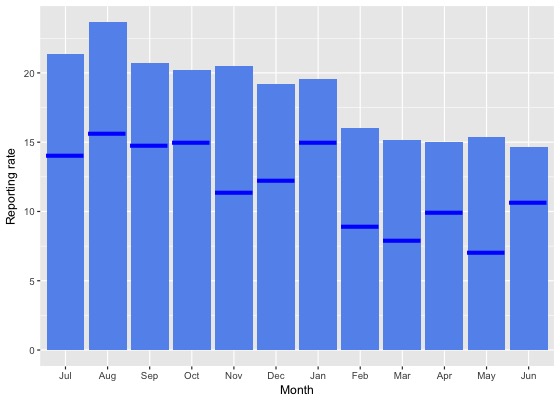
Reporting rate by season
This chart shows the seasonal reporting rate of Laughing Kookaburra. The blue lines show the seasonal reporting rate for the twelve months to June 2017 and the bars show the average seasonal reporting rate for the period 1982 to 2017. 
Reporting rate data
| Month | Season | ||||||||||||||||||
|---|---|---|---|---|---|---|---|---|---|---|---|---|---|---|---|---|---|---|---|
| Period | Jul | Aug | Sep | Oct | Nov | Dec | Jan | Feb | Mar | Apr | May | Jun | Winter | Spring | Summer | Autumn | All | ||
| All years | |||||||||||||||||||
| All | 21.3 | 23.6 | 20.7 | 20.2 | 20.5 | 19.2 | 19.5 | 16.0 | 15.2 | 15.0 | 15.4 | 14.7 | 19.3 | 20.4 | 18.4 | 15.2 | 18.4 | ||
| Previous years | |||||||||||||||||||
| All previous years | 22.5 | 25.2 | 21.6 | 20.9 | 22.0 | 20.2 | 20.4 | 17.5 | 16.5 | 15.8 | 17.3 | 15.5 | 20.4 | 21.4 | 19.5 | 16.4 | 19.5 | ||
| Previous 30 years | 22.6 | 25.4 | 21.6 | 21.1 | 22.1 | 20.4 | 20.3 | 17.6 | 16.5 | 15.7 | 17.3 | 15.5 | 20.5 | 21.5 | 19.6 | 16.4 | 19.6 | ||
| Previous 20 years | 17.8 | 21.6 | 17.7 | 18.5 | 17.2 | 16.8 | 17.0 | 14.1 | 12.9 | 12.6 | 13.3 | 12.6 | 16.6 | 17.9 | 16.1 | 12.9 | 16.0 | ||
| 10 year groups | |||||||||||||||||||
| [2007,2017) | 16.6 | 20.0 | 16.3 | 17.9 | 15.1 | 15.5 | 15.5 | 12.6 | 12.1 | 11.6 | 11.9 | 12.2 | 15.7 | 16.8 | 14.7 | 11.8 | 14.8 | ||
| [1997,2007) | 19.8 | 25.0 | 20.5 | 20.5 | 21.4 | 19.5 | 21.7 | 18.1 | 14.8 | 15.2 | 16.4 | 13.6 | 18.6 | 20.8 | 19.8 | 15.3 | 18.7 | ||
| [1987,1997) | 39.3 | 37.0 | 41.8 | 36.2 | 38.3 | 40.6 | 40.0 | 33.9 | 36.2 | 31.7 | 32.3 | 30.0 | 35.4 | 38.6 | 38.3 | 33.4 | 36.5 | ||
| 5 year groups | |||||||||||||||||||
| [2012,2017) | 16.5 | 19.9 | 15.7 | 17.3 | 13.3 | 14.5 | 14.7 | 11.8 | 12.0 | 12.1 | 11.1 | 12.3 | 15.9 | 15.8 | 13.8 | 11.8 | 14.3 | ||
| [2007,2012) | 16.8 | 20.3 | 17.6 | 18.9 | 19.8 | 17.6 | 18.4 | 15.8 | 12.4 | 10.3 | 14.3 | 12.0 | 15.0 | 18.7 | 17.5 | 12.0 | 16.1 | ||
| [2002,2007) | 20.3 | 26.8 | 19.7 | 20.5 | 21.8 | 19.2 | 20.8 | 17.0 | 12.9 | 13.9 | 15.7 | 13.4 | 19.0 | 20.6 | 19.1 | 13.9 | 18.2 | ||
| [1997,2002) | 19.1 | 23.0 | 21.5 | 20.6 | 20.9 | 19.8 | 22.8 | 19.3 | 17.3 | 16.7 | 17.3 | 13.9 | 18.0 | 21.0 | 20.5 | 17.1 | 19.3 | ||
| [1992,1997) | 19.4 | 18.3 | 22.1 | 20.3 | 21.7 | 21.7 | 19.7 | 17.6 | 18.4 | 15.1 | 16.8 | 13.3 | 16.9 | 21.3 | 19.8 | 16.8 | 18.8 | ||
| [1987,1992) | 48.3 | 47.2 | 51.0 | 44.9 | 46.3 | 48.8 | 51.1 | 40.1 | 46.8 | 41.1 | 40.3 | 39.4 | 45.1 | 47.2 | 46.7 | 42.7 | 45.6 | ||
| Year | |||||||||||||||||||
| 2017 | 14.1 | 15.7 | 14.8 | 15.0 | 11.4 | 12.2 | 15.0 | 8.9 | 7.9 | 10.0 | 7.1 | 10.7 | 13.1 | 13.8 | 12.2 | 8.3 | 11.8 | ||
| 2016 | 18.6 | 18.6 | 15.1 | 17.4 | 12.0 | 9.2 | 12.1 | 10.2 | 12.1 | 11.7 | 10.8 | 12.8 | 16.7 | 15.3 | 10.6 | 11.6 | 13.3 | ||
| 2015 | 11.7 | 21.7 | 17.5 | 16.9 | 14.4 | 16.5 | 14.4 | 11.5 | 11.2 | 12.0 | 10.5 | 11.7 | 14.5 | 16.4 | 14.2 | 11.3 | 14.1 | ||
| 2014 | 16.4 | 17.2 | 14.5 | 19.9 | 11.5 | 18.7 | 17.9 | 14.0 | 13.1 | 12.3 | 11.4 | 13.6 | 15.3 | 16.6 | 16.9 | 12.4 | 15.4 | ||
| 2013 | 13.6 | 19.5 | 13.5 | 18.6 | 16.7 | 16.7 | 16.5 | 14.4 | 10.3 | 10.9 | 9.6 | 7.9 | 13.2 | 16.6 | 16.1 | 10.4 | 14.4 | ||
| 2012 | 22.1 | 24.0 | 17.6 | 14.5 | 12.3 | 16.2 | 15.4 | 13.2 | 14.0 | 14.9 | 16.0 | 14.8 | 19.8 | 14.8 | 15.2 | 14.8 | 15.9 | ||
| 2011 | 16.3 | 21.6 | 21.3 | 21.2 | 18.2 | 15.2 | 17.8 | 11.9 | 10.3 | 11.3 | 11.3 | 14.5 | 16.4 | 20.7 | 15.3 | 10.9 | 15.8 | ||
| 2010 | 18.8 | 16.7 | 15.4 | 18.1 | 21.5 | 17.5 | 16.4 | 12.9 | 11.0 | 9.4 | 11.8 | 6.9 | 11.7 | 18.1 | 16.4 | 10.5 | 14.8 | ||
| 2009 | 12.9 | 16.7 | 18.4 | 17.1 | 17.4 | 13.8 | 22.0 | 16.7 | 13.0 | 9.0 | 13.7 | 11.3 | 12.9 | 17.5 | 17.2 | 11.5 | 15.2 | ||
| 2008 | 20.0 | 27.0 | 18.7 | 19.1 | 20.8 | 22.5 | 23.8 | 18.5 | 16.7 | 10.9 | 21.6 | 12.6 | 18.4 | 19.2 | 21.9 | 14.5 | 18.4 | ||
| 2007 | 16.5 | 18.5 | 13.7 | 19.2 | 21.6 | 19.1 | 16.1 | 21.7 | 12.8 | 10.7 | 17.1 | 13.7 | 15.2 | 18.1 | 18.4 | 12.8 | 16.4 | ||
| 2006 | 21.1 | 33.0 | 15.9 | 25.3 | 15.5 | 17.3 | 18.0 | 18.5 | 13.2 | 14.0 | 21.0 | 14.9 | 20.3 | 20.5 | 17.9 | 15.0 | 18.5 | ||
| 2005 | 19.1 | 18.7 | 16.0 | 14.4 | 17.2 | 20.7 | 25.5 | 20.7 | 13.4 | 10.9 | 13.4 | 11.8 | 15.2 | 15.8 | 22.1 | 12.7 | 16.2 | ||
| 2004 | 19.0 | 28.3 | 23.6 | 19.8 | 24.4 | 18.4 | 21.2 | 18.2 | 9.3 | 14.3 | 15.5 | 9.2 | 18.7 | 22.6 | 19.3 | 12.6 | 18.5 | ||
| 2003 | 25.6 | 24.5 | 19.1 | 20.2 | 27.1 | 24.2 | 20.0 | 14.3 | 13.9 | 16.6 | 12.4 | 17.4 | 22.1 | 22.1 | 19.9 | 14.6 | 19.6 | ||
| 2002 | 18.9 | 29.7 | 25.9 | 18.0 | 22.5 | 16.2 | 20.1 | 15.8 | 14.1 | 13.1 | 17.6 | 13.4 | 19.4 | 21.9 | 17.1 | 14.4 | 18.4 | ||
| 2001 | 22.2 | 25.9 | 22.3 | 22.7 | 24.4 | 27.5 | 21.0 | 21.1 | 16.9 | 16.6 | 20.8 | 16.3 | 21.2 | 22.9 | 23.7 | 17.7 | 21.4 | ||
| 2000 | 23.0 | 24.2 | 24.2 | 24.2 | 21.3 | 16.4 | 22.7 | 20.5 | 22.4 | 18.6 | 20.0 | 19.9 | 22.2 | 23.3 | 19.6 | 20.5 | 21.3 | ||
| 1999 | 17.6 | 21.6 | 20.1 | 20.1 | 27.9 | 26.2 | 26.3 | 22.9 | 17.8 | 18.6 | 14.2 | 9.8 | 13.9 | 22.6 | 25.2 | 16.9 | 19.8 | ||
| 1998 | 8.1 | 22.6 | 24.4 | 13.0 | 15.9 | 13.2 | 22.1 | 9.4 | 4.3 | 7.7 | 11.1 | 13.3 | 15.2 | 18.3 | 15.0 | 6.3 | 14.7 | ||
| 1997 | 10.3 | 13.8 | 12.7 | 13.2 | 10.3 | 5.8 | 21.6 | 8.8 | 17.5 | 12.8 | 13.3 | 4.2 | 9.2 | 11.9 | 10.4 | 13.9 | 11.3 | ||
| 1996 | 10.4 | 14.9 | 22.7 | 18.4 | 14.8 | 18.2 | 18.4 | 11.8 | 11.8 | 14.1 | 12.1 | 19.5 | 15.3 | 18.2 | 16.4 | 12.5 | 15.8 | ||
| 1995 | 12.9 | 9.3 | 8.7 | 10.4 | 13.6 | 11.5 | 15.0 | 12.7 | 11.2 | 12.1 | 13.0 | 9.6 | 10.4 | 10.9 | 13.3 | 12.0 | 11.6 | ||
| 1994 | 21.6 | 31.2 | 30.9 | 29.1 | 23.5 | 26.1 | 22.1 | 15.5 | 15.9 | 8.4 | 11.2 | 11.2 | 20.7 | 26.9 | 20.9 | 11.4 | 19.7 | ||
| 1993 | 22.4 | 32.1 | 30.6 | 26.7 | 34.8 | 43.5 | 32.7 | 28.1 | 37.0 | 28.3 | 24.7 | 15.9 | 24.0 | 30.5 | 35.4 | 30.3 | 29.6 | ||
| 1992 | 33.8 | 7.4 | 24.7 | 26.6 | 29.2 | 22.2 | 17.2 | 31.7 | 19.7 | 23.7 | 22.4 | 10.0 | 17.9 | 26.7 | 22.8 | 21.8 | 22.7 | ||
| 1991 | 18.9 | 14.9 | 19.8 | 18.4 | 18.6 | 12.2 | 25.0 | 18.0 | 27.0 | 30.5 | 18.0 | 26.0 | 18.8 | 18.9 | 17.8 | 25.1 | 19.9 | ||
| 1990 | 51.6 | 48.6 | 33.3 | 19.4 | 27.1 | 38.9 | 44.4 | 25.4 | 27.3 | 22.6 | 21.9 | 26.3 | 45.7 | 26.5 | 36.3 | 24.1 | 34.6 | ||
| 1989 | 60.2 | 52.6 | 65.1 | 55.0 | 54.5 | 58.7 | 59.6 | 43.3 | 54.4 | 41.5 | 51.3 | 42.9 | 52.3 | 58.2 | 54.1 | 48.8 | 53.7 | ||
| 1988 | 52.2 | 53.7 | 57.9 | 55.1 | 54.7 | 55.9 | 54.8 | 48.0 | 54.5 | 50.3 | 44.9 | 51.2 | 52.5 | 55.6 | 53.1 | 49.9 | 52.9 | ||
| 1987 | 45.5 | 33.3 | 50.6 | 44.9 | 48.4 | 47.9 | 49.2 | 40.8 | 46.9 | 42.8 | 40.6 | 32.8 | 33.5 | 48.0 | 45.7 | 43.3 | 44.6 | ||
| 1986 | 19.2 | 28.9 | 35.8 | 25.0 | 36.2 | 17.6 | 30.4 | 36.1 | 29.0 | 37.3 | 27.6 | 14.3 | 21.2 | 33.1 | 28.0 | 32.4 | 29.2 | ||
| 1985 | 13.3 | 6.7 | 5.8 | 4.7 | 5.3 | 8.3 | 12.5 | 17.6 | 27.3 | 31.6 | 50.0 | 32.1 | 17.0 | 5.1 | 10.6 | 35.0 | 11.8 | ||
| 1984 | 0.0 | 0.0 | 0.0 | 0.0 | 0.0 | 0.0 | 31.0 | 3.0 | 3.7 | 8.8 | 12.9 | 5.9 | 4.1 | 0.0 | 13.5 | 8.7 | 8.5 | ||
| 1983 | 0.0 | 0.0 | 0.0 | 0.0 | 11.1 | 7.7 | 0.0 | 0.0 | 0.0 | - | 0.0 | 0.0 | 0.0 | 3.7 | 3.3 | 0.0 | 2.0 | ||
| 1982 | - | 0.0 | - | 0.0 | 0.0 | 0.0 | - | 0.0 | - | 0.0 | - | 0.0 | 0.0 | 0.0 | 0.0 | 0.0 | 0.0 | ||
Breeding data
Breeding records by month
Number of breeding records by breeding code and month, 2017 and all years| Breeding code | Jul | Aug | Sep | Oct | Nov | Dec | Jan | Feb | Mar | Apr | May | Jun |
|---|---|---|---|---|---|---|---|---|---|---|---|---|
| 2017 | ||||||||||||
| Breeding (BLA code) | 0 | 0 | 0 | 1 | 0 | 0 | 0 | 0 | 0 | 0 | 0 | 0 |
| Carrying Food | 0 | 0 | 0 | 0 | 0 | 0 | 0 | 0 | 0 | 0 | 0 | 0 |
| Copulating | 0 | 0 | 0 | 0 | 0 | 0 | 0 | 0 | 0 | 0 | 0 | 0 |
| Display | 0 | 0 | 0 | 0 | 0 | 0 | 0 | 0 | 0 | 0 | 0 | 0 |
| Dependent young | 0 | 0 | 0 | 1 | 0 | 0 | 5 | 1 | 0 | 0 | 0 | 0 |
| Faecal sac | 0 | 0 | 0 | 0 | 0 | 0 | 0 | 0 | 0 | 0 | 0 | 0 |
| Inspecting hollow | 0 | 0 | 0 | 0 | 0 | 0 | 0 | 0 | 0 | 0 | 0 | 0 |
| Nest building | 0 | 0 | 0 | 0 | 0 | 0 | 0 | 0 | 0 | 0 | 0 | 0 |
| Nest with eggs | 0 | 0 | 0 | 0 | 0 | 0 | 0 | 0 | 0 | 0 | 0 | 0 |
| Nest with young | 0 | 0 | 0 | 0 | 0 | 0 | 1 | 0 | 0 | 0 | 0 | 0 |
| On/leaving nest | 0 | 0 | 0 | 2 | 1 | 3 | 0 | 0 | 0 | 0 | 0 | 0 |
| All years | ||||||||||||
| Breeding (BLA code) | 0 | 0 | 0 | 3 | 2 | 2 | 3 | 0 | 1 | 0 | 0 | 0 |
| Carrying Food | 0 | 0 | 1 | 10 | 13 | 2 | 0 | 1 | 0 | 0 | 0 | 0 |
| Copulating | 1 | 0 | 1 | 0 | 0 | 0 | 0 | 0 | 0 | 0 | 0 | 0 |
| Display | 0 | 0 | 0 | 0 | 1 | 0 | 0 | 0 | 0 | 0 | 0 | 0 |
| Dependent young | 0 | 0 | 0 | 6 | 12 | 27 | 19 | 1 | 0 | 0 | 0 | 0 |
| Faecal sac | 0 | 0 | 0 | 0 | 0 | 0 | 0 | 0 | 0 | 0 | 0 | 0 |
| Inspecting hollow | 1 | 6 | 3 | 2 | 2 | 0 | 0 | 0 | 0 | 0 | 0 | 3 |
| Nest building | 0 | 1 | 6 | 4 | 2 | 1 | 2 | 0 | 0 | 0 | 0 | 0 |
| Nest with eggs | 0 | 0 | 0 | 5 | 1 | 1 | 0 | 0 | 0 | 0 | 0 | 0 |
| Nest with young | 0 | 0 | 0 | 2 | 17 | 5 | 1 | 0 | 0 | 0 | 0 | 0 |
| On/leaving nest | 0 | 0 | 2 | 5 | 3 | 3 | 0 | 0 | 0 | 0 | 0 | 0 |
Breeding records by year
Average number of breeding records per period by breeding code| Period | Breeding (BLA code) | Carrying Food | Copulating | Display | Dependent young | Faecal sac | Inspecting hollow | Nest building | Nest with eggs | Nest with young | On/leaving nest |
|---|---|---|---|---|---|---|---|---|---|---|---|
| All years | |||||||||||
| All | 0.3 | 0.8 | 0.1 | 0.0 | 1.8 | 0.0 | 0.5 | 0.4 | 0.2 | 0.7 | 0.4 |
| Previous years | |||||||||||
| All previous years | 0.3 | 0.8 | 0.1 | 0.0 | 1.7 | 0.0 | 0.5 | 0.5 | 0.2 | 0.7 | 0.2 |
| Previous 30 years | 0.3 | 0.9 | 0.1 | 0.0 | 1.9 | 0.0 | 0.6 | 0.5 | 0.2 | 0.8 | 0.2 |
| Previous 20 years | 0.5 | 0.9 | 0.1 | 0.0 | 1.4 | 0.0 | 0.8 | 0.0 | 0.1 | 0.5 | 0.3 |
| 10 year groups | |||||||||||
| [2007,2017) | 0.3 | 1.3 | 0.1 | 0.1 | 2.0 | 0.0 | 1.0 | 0.0 | 0.2 | 0.7 | 0.5 |
| [1997,2007) | 0.7 | 0.6 | 0.1 | 0.0 | 0.9 | 0.0 | 0.7 | 0.1 | 0.0 | 0.2 | 0.1 |
| [1987,1997) | 0.0 | 0.8 | 0.0 | 0.0 | 2.9 | 0.0 | 0.0 | 1.5 | 0.5 | 1.5 | 0.1 |
| 5 year groups | |||||||||||
| [2012,2017) | 0.4 | 1.0 | 0.0 | 0.0 | 2.6 | 0.0 | 0.8 | 0.0 | 0.4 | 1.4 | 0.8 |
| [2007,2012) | 0.2 | 1.6 | 0.2 | 0.2 | 1.4 | 0.0 | 1.2 | 0.0 | 0.0 | 0.0 | 0.2 |
| [2002,2007) | 0.2 | 0.8 | 0.2 | 0.0 | 0.6 | 0.0 | 0.8 | 0.0 | 0.0 | 0.2 | 0.2 |
| [1997,2002) | 1.2 | 0.4 | 0.0 | 0.0 | 1.2 | 0.0 | 0.6 | 0.2 | 0.0 | 0.2 | 0.0 |
| [1992,1997) | 0.0 | 0.6 | 0.0 | 0.0 | 0.8 | 0.0 | 0.0 | 0.2 | 0.0 | 0.2 | 0.2 |
| [1987,1992) | 0.0 | 1.0 | 0.0 | 0.0 | 5.0 | 0.0 | 0.0 | 2.8 | 1.0 | 2.8 | 0.0 |
| Year | |||||||||||
| 2017 | 1.0 | 0.0 | 0.0 | 0.0 | 7.0 | 0.0 | 0.0 | 0.0 | 0.0 | 1.0 | 6.0 |
| 2016 | 1.0 | 1.0 | 0.0 | 0.0 | 4.0 | 0.0 | 2.0 | 0.0 | 1.0 | 6.0 | 1.0 |
| 2015 | 0.0 | 0.0 | 0.0 | 0.0 | 5.0 | 0.0 | 1.0 | 0.0 | 0.0 | 1.0 | 0.0 |
| 2014 | 0.0 | 1.0 | 0.0 | 0.0 | 1.0 | 0.0 | 1.0 | 0.0 | 1.0 | 0.0 | 1.0 |
| 2013 | 0.0 | 2.0 | 0.0 | 0.0 | 3.0 | 0.0 | 0.0 | 0.0 | 0.0 | 0.0 | 0.0 |
| 2012 | 1.0 | 1.0 | 0.0 | 0.0 | 0.0 | 0.0 | 0.0 | 0.0 | 0.0 | 0.0 | 2.0 |
| 2011 | 0.0 | 1.0 | 0.0 | 0.0 | 1.0 | 0.0 | 2.0 | 0.0 | 0.0 | 0.0 | 0.0 |
| 2010 | 0.0 | 4.0 | 0.0 | 0.0 | 4.0 | 0.0 | 2.0 | 0.0 | 0.0 | 0.0 | 0.0 |
| 2009 | 1.0 | 0.0 | 0.0 | 1.0 | 1.0 | 0.0 | 0.0 | 0.0 | 0.0 | 0.0 | 1.0 |
| 2008 | 0.0 | 0.0 | 1.0 | 0.0 | 1.0 | 0.0 | 0.0 | 0.0 | 0.0 | 0.0 | 0.0 |
| 2007 | 0.0 | 3.0 | 0.0 | 0.0 | 0.0 | 0.0 | 2.0 | 0.0 | 0.0 | 0.0 | 0.0 |
| 2006 | 1.0 | 0.0 | 0.0 | 0.0 | 2.0 | 0.0 | 1.0 | 0.0 | 0.0 | 0.0 | 0.0 |
| 2005 | 0.0 | 0.0 | 0.0 | 0.0 | 0.0 | 0.0 | 3.0 | 0.0 | 0.0 | 0.0 | 0.0 |
| 2004 | 0.0 | 1.0 | 1.0 | 0.0 | 0.0 | 0.0 | 0.0 | 0.0 | 0.0 | 0.0 | 1.0 |
| 2003 | 0.0 | 2.0 | 0.0 | 0.0 | 1.0 | 0.0 | 0.0 | 0.0 | 0.0 | 0.0 | 0.0 |
| 2002 | 0.0 | 1.0 | 0.0 | 0.0 | 0.0 | 0.0 | 0.0 | 0.0 | 0.0 | 1.0 | 0.0 |
| 2001 | 0.0 | 0.0 | 0.0 | 0.0 | 4.0 | 0.0 | 0.0 | 0.0 | 0.0 | 0.0 | 0.0 |
| 2000 | 1.0 | 0.0 | 0.0 | 0.0 | 1.0 | 0.0 | 1.0 | 1.0 | 0.0 | 1.0 | 0.0 |
| 1999 | 5.0 | 0.0 | 0.0 | 0.0 | 0.0 | 0.0 | 2.0 | 0.0 | 0.0 | 0.0 | 0.0 |
| 1998 | 0.0 | 1.0 | 0.0 | 0.0 | 1.0 | 0.0 | 0.0 | 0.0 | 0.0 | 0.0 | 0.0 |
| 1997 | 0.0 | 1.0 | 0.0 | 0.0 | 0.0 | 0.0 | 0.0 | 0.0 | 0.0 | 0.0 | 0.0 |
| 1996 | 0.0 | 1.0 | 0.0 | 0.0 | 0.0 | 0.0 | 0.0 | 0.0 | 0.0 | 0.0 | 0.0 |
| 1995 | 0.0 | 0.0 | 0.0 | 0.0 | 1.0 | 0.0 | 0.0 | 0.0 | 0.0 | 0.0 | 0.0 |
| 1994 | 0.0 | 1.0 | 0.0 | 0.0 | 2.0 | 0.0 | 0.0 | 0.0 | 0.0 | 0.0 | 0.0 |
| 1993 | 0.0 | 1.0 | 0.0 | 0.0 | 0.0 | 0.0 | 0.0 | 0.0 | 0.0 | 1.0 | 1.0 |
| 1992 | 0.0 | 0.0 | 0.0 | 0.0 | 1.0 | 0.0 | 0.0 | 1.0 | 0.0 | 0.0 | 0.0 |
| 1991 | 0.0 | 0.0 | 0.0 | 0.0 | 0.0 | 0.0 | 0.0 | 0.0 | 0.0 | 0.0 | 0.0 |
| 1990 | 0.0 | 1.0 | 0.0 | 0.0 | 0.0 | 0.0 | 0.0 | 0.0 | 0.0 | 0.0 | 0.0 |
| 1989 | 0.0 | 2.0 | 0.0 | 0.0 | 10.0 | 0.0 | 0.0 | 5.0 | 3.0 | 4.0 | 0.0 |
| 1988 | 0.0 | 1.0 | 0.0 | 0.0 | 6.0 | 0.0 | 0.0 | 4.0 | 1.0 | 2.0 | 0.0 |
| 1987 | 0.0 | 1.0 | 0.0 | 0.0 | 9.0 | 0.0 | 0.0 | 5.0 | 1.0 | 8.0 | 0.0 |
| 1986 | 0.0 | 0.0 | 0.0 | 0.0 | 0.0 | 0.0 | 0.0 | 0.0 | 0.0 | 0.0 | 0.0 |
| 1985 | 0.0 | 0.0 | 0.0 | 0.0 | 0.0 | 0.0 | 0.0 | 0.0 | 0.0 | 0.0 | 0.0 |
| 1984 | 0.0 | 0.0 | 0.0 | 0.0 | 0.0 | 0.0 | 0.0 | 0.0 | 0.0 | 0.0 | 0.0 |
| 1983 | 0.0 | 0.0 | 0.0 | 0.0 | 0.0 | 0.0 | 0.0 | 0.0 | 0.0 | 0.0 | 0.0 |
| 1982 | 0.0 | 0.0 | 0.0 | 0.0 | 0.0 | 0.0 | 0.0 | 0.0 | 0.0 | 0.0 | 0.0 |
Distribution map
Distribution - 2017
This map shows the observed distribution of the Laughing Kookaburra for 2017.
The red circles are the grid cells where Laughing Kookaburra have been reported.
The transparency of the red circles indicate how many surveys sheets were submitted for that grid cell; the darker the red the more reliable the data. Of the 315 grid cells with reports, 83 had only one sheet; an example is grid number A9.
The size of the circle represents the reporting rate. The maximum reporting rate for Laughing Kookaburra was 100.0% (eg grid number A9) and the minimum was 0.4% (eg grid number S13). 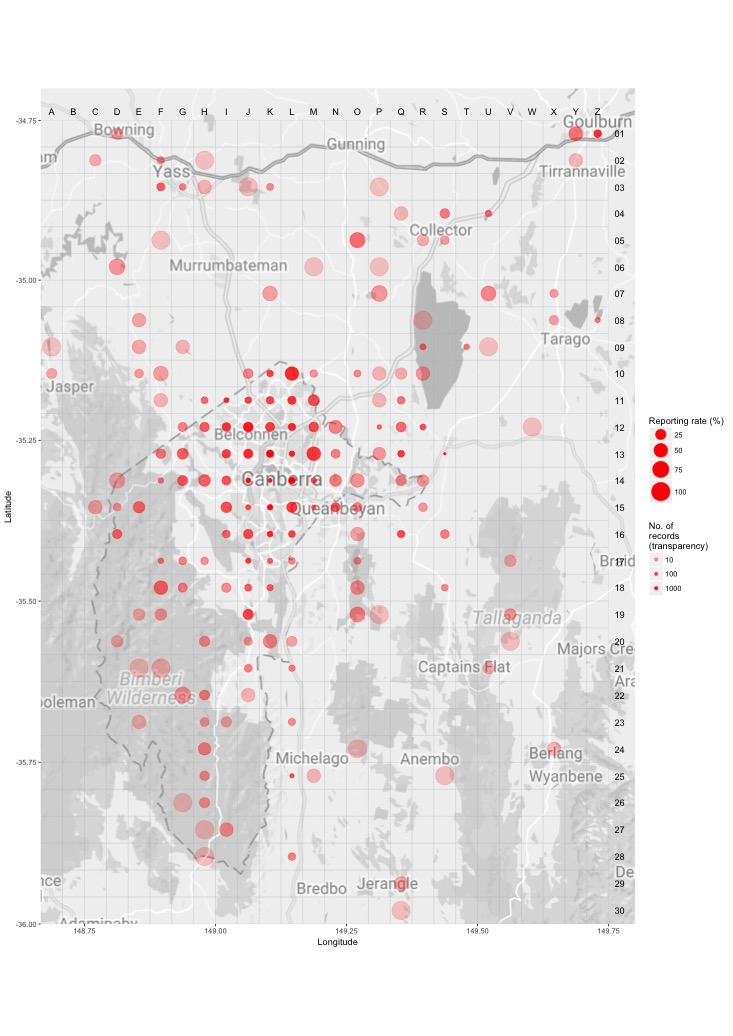
Distribution - all years
This map shows the observed distribution of the Laughing Kookaburra for all years.
The red circles are the grid cells where Laughing Kookaburra have been reported.
The transparency of the red circles indicate how many surveys sheets were submitted for that grid cell; the darker the red the more reliable the data. Of the 703 grid cells with reports, 55 had only one sheet; an example is grid number B13.
The size of the circle represents the reporting rate. The maximum reporting rate for Laughing Kookaburra was 100.0% (eg grid number A30) and the minimum was 0.7% (eg grid number S13). 
Breeding map
Breeding - 2017
This map shows the breeding distribution of the Laughing Kookaburra for 2017.
The red circles are the grid cells where breeding activity for Laughing Kookaburra have been reported.
The size of the circle represents the number of reports. 
Breeding - all years
This map shows the breeding distribution of the Laughing Kookaburra for all years.
The red circles are the grid cells where breeding activity for Laughing Kookaburra have been reported.
The size of the circle represents the number of reports. 